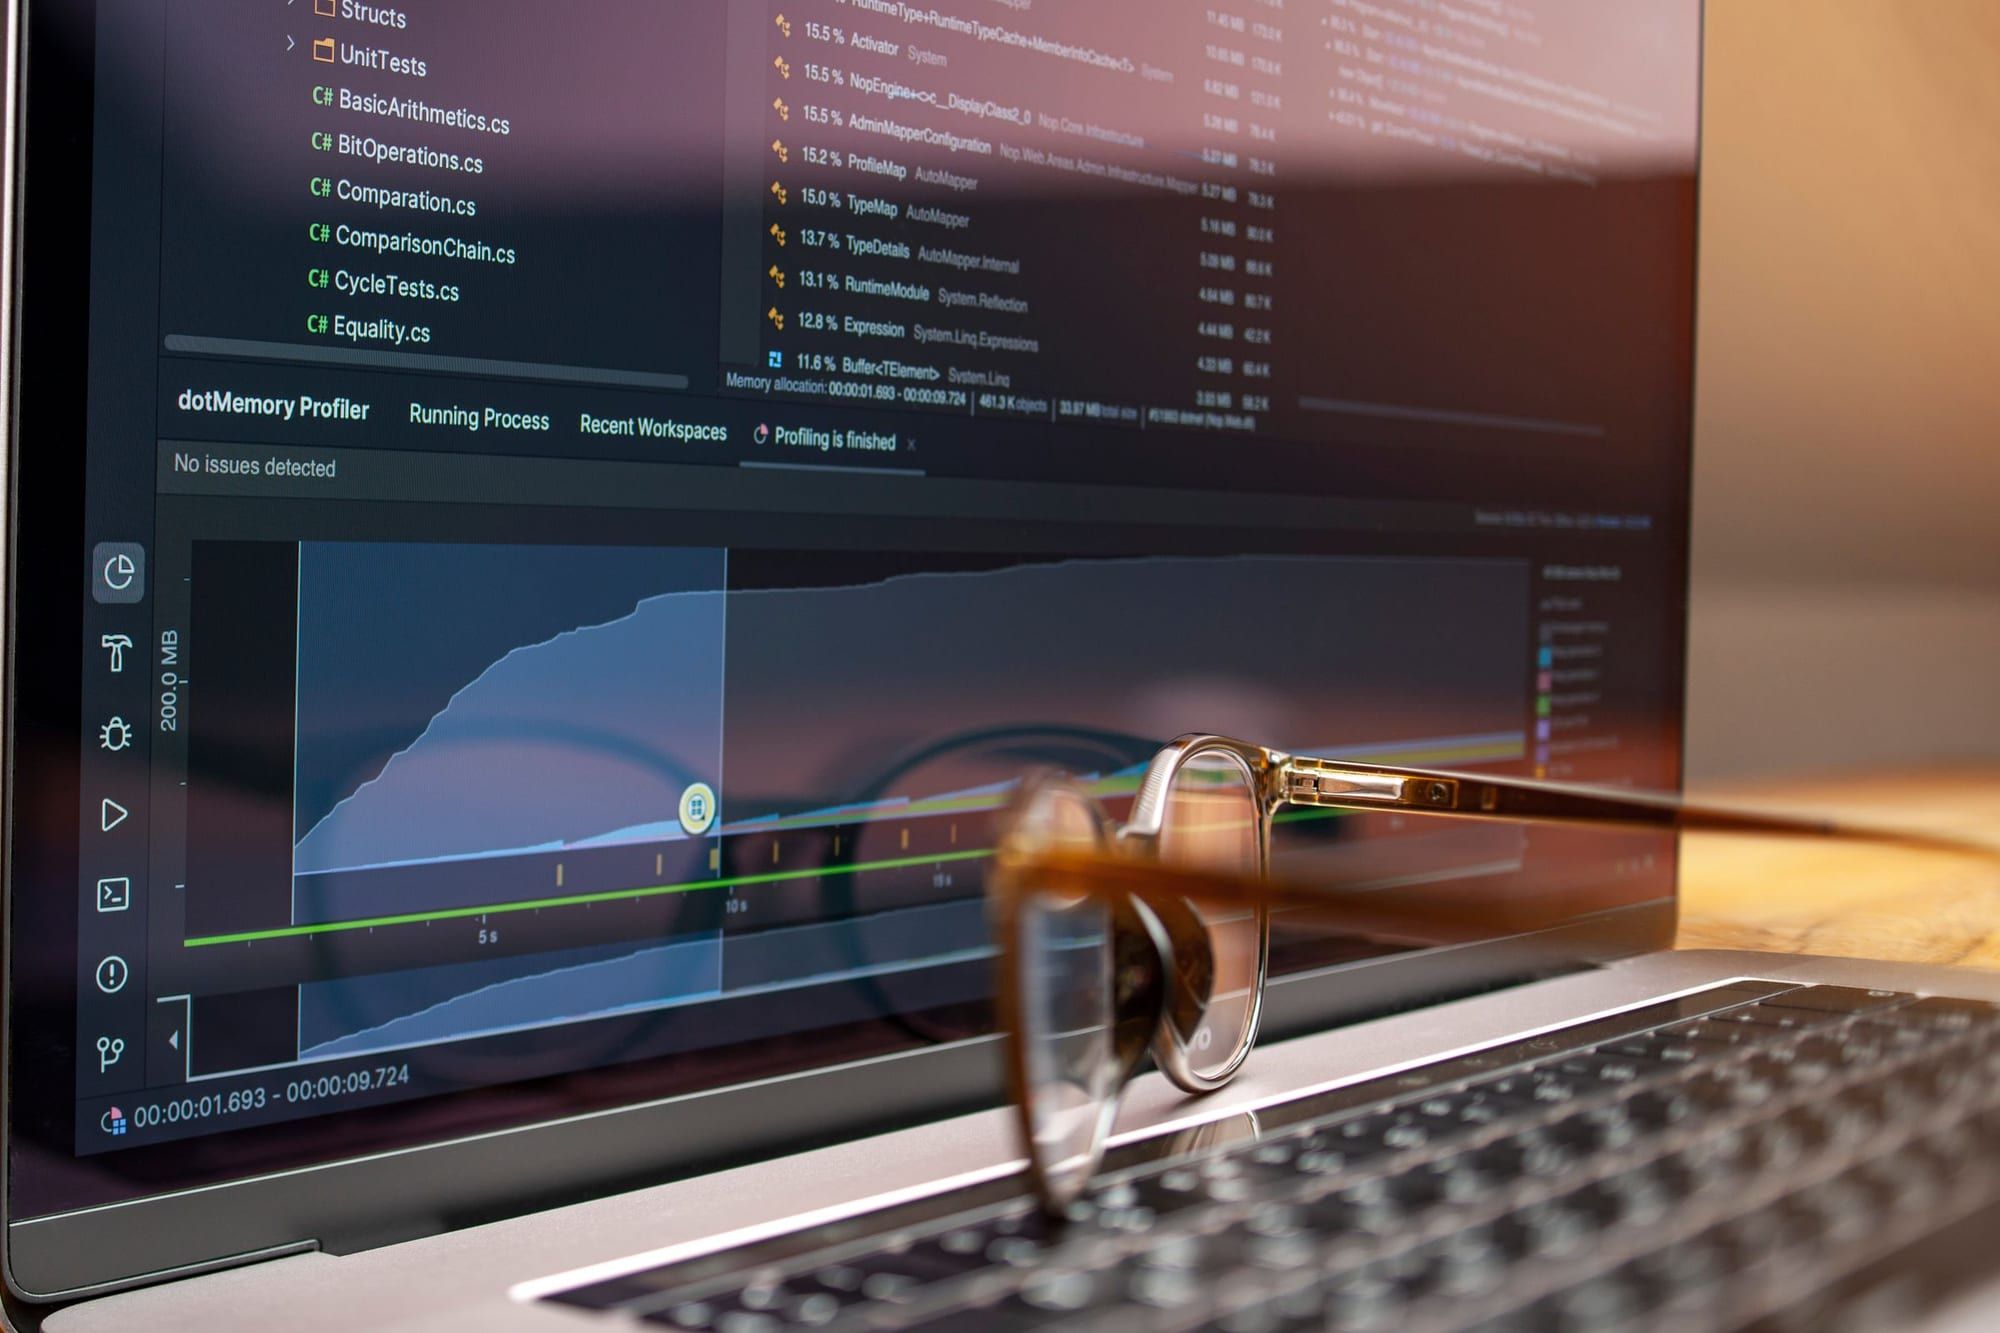
Observability and alerts that flag what matters
Find out about an outage before your customers do, know why it happened and stop getting alerts nobody reads.
Usual tools
- ClickHouse
- Elasticsearch
- Grafana
- Prometheus
- Graylog
- Kafka
- Matomo
- RabbitMQ
In short
Observability is the ability to know what is happening inside your platform from its metrics, its logs and its traces. We set up Prometheus for metrics, Loki and Alloy for logs, OpenTelemetry for traces and Grafana for dashboards, with alerts on agreed thresholds that flag what affects the service rather than everything.
- Languages
- Spanish, Catalan or English
- Response
- The next business day, during business hours
- Method
- In your account and your repository, in code and documented
What is included
- Infrastructure and application metrics with Prometheus.
- Centralised logs with Loki and Grafana Alloy, with an agreed retention period.
- Traces with OpenTelemetry in the services that need them most.
- Grafana dashboards per service, with the key signals at the top.
- Alerts with Alertmanager, agreed thresholds and a clear channel.
- Availability objectives (SLOs) for critical services.
- A short guide on what to do with each alert.
- Everything deployed as code, in your repository.
When does observability need reviewing?
Almost every time someone says “we have monitoring” but outages are still reported by a customer. The usual signs:
- Outages are discovered through a customer email or on social media.
- There is an alerts channel with hundreds of messages nobody reads.
- Finding an error means logging in to each server over SSH and searching the logs.
- Nobody can say what availability the service had last month.
- The Grafana dashboards exist, but they were built by someone who has left.
Which signal is for what?
Metrics, logs and traces are not three ways of looking at the same thing: each one answers a different question. This is how we split them:
| Signal | Question it answers | Tool | Example |
|---|---|---|---|
| Metrics | Is the service healthy right now and how is it trending? | Prometheus | 95th percentile latency or errors per minute |
| Logs | What exactly happened at this moment? | Loki with Alloy | The error and the request that caused it |
| Traces | Where in the chain is the time being lost? | OpenTelemetry | A request that is slow in the database |
| Alerts | Does someone need to act now? | Alertmanager | Errors above the threshold for 5 minutes |
| SLO | Are we delivering what we promised? | Prometheus and Grafana | 99.9% of requests successful over 30 days |
The same applies beyond the web: on IoT platforms such as ThingsBoard or an IoT platform with MQTT, we also monitor data ingestion, message queues and connected devices. And if you want to measure visits to your website without handing the data to third parties, we set up Matomo on your server.
How do we design alerts?
An alert that does not lead to an action is noise, and noise makes people ignore the important ones. We follow three rules:
- By symptom, not by cause: first what the user notices (errors, latency, downtime), then the causes (CPU, disk) as warnings.
- With an agreed threshold: the threshold and the window are decided with you, based on what your service can tolerate.
- With instructions: every alert links to a guide on what to check and what to do.
The result is measured: fewer alerts, quicker to handle, and no outage that a customer spots first.
How is it rolled out?
Review
What is monitored today, what is missed and which alerts are ignored.
Metrics and logs
Prometheus, Loki and Alloy deployed as code, with agreed retention and storage.
Dashboards and SLOs
One dashboard per service and availability objectives for the critical ones.
Alerts
Agreed thresholds, a notification channel and a guide for each one.
What experience do we have?
Observability has been part of our whole track record. In DevOps at a B2B SaaS company we have improved the platform’s observability and disaster recovery; in a CTO role, 99.9% availability was sustained by alerts that fired before customers noticed. We work daily with Prometheus, Grafana, Loki, Alloy and Alertmanager. If you want someone to handle those alerts every month, it fits with SRE as a service.
Frequently asked questions
Why not use a commercial monitoring service?
It can be a good option and we will tell you if it fits. Prometheus, Loki and Grafana usually pay off when the volume of data makes the commercial service expensive or when the data cannot leave your infrastructure.
How many alerts should I have?
Few, and actionable. Every alert that wakes someone up must have a clear action; the rest goes to a dashboard or a daily summary. We start with the ones that affect your users and add more from there.
Who responds to the alerts?
Your team, with the guide we leave, or us as part of SRE as a service. Alerts fire at any hour; the response is next business day, in business hours.
Tell us about your case
In a free 20-minute call we look at where you are and where to start. No commitment.
Reviewed on